
Table of contents
BlogPublished May 29, 2026 · 23 min read
Last updated:
How to Read an Options Chain for Sellers (Strikes, Bid/Ask, and Liquidity)
Learn how to read an options chain when selling premium: bid-ask spreads, open interest, delta, DTE, and seven checks before you short a put or covered call.
Every short put or covered call starts on the options chain: a table of strikes and expirations with prices that move faster than intuition. Sellers who skip the chain often discover wide spreads and thin liquidity only after they try to close.
Reading the chain is not memorizing every column. It is asking whether you can enter and exit at fair prices, whether the strike matches your risk budget, and whether open interest supports your size.
This guide walks column by column for premium sellers, with seven pre-trade checks and links to Greeks, IV, and collateral articles on this blog.
You will learn chain layout, bid/ask and open interest, delta and DTE for strike selection, and how sellers use the chain differently from buyers.
Options chain layout: what each row means
An option chain lists calls on one side and puts on the other (or stacked by strike) for a single underlying and expiration. Each row is one contract specification: strike, last, bid, ask, volume, open interest, and often implied volatility and Greeks.
Core columns sellers should read first:
- Strike: price where obligation begins
- Bid / Ask: where you can realistically sell and buy back
- Last: last trade; can be stale on illiquid lines
- Volume: contracts traded today
- Open interest: open contracts outstanding
- IV: implied volatility priced into the option
- Delta: approximate share-equivalent exposure
CBOE education and OCC resources explain contract specs; your broker platform may label columns differently.
An actual chain, read line by line
Column definitions only go so far. Here is the put side of a chain on a $50 stock, 35 days to expiration: the view a cash-secured put seller is actually looking at.
| Strike | Bid | Ask | Volume | Open interest | IV | Delta |
|---|---|---|---|---|---|---|
| $52.50 | $3.40 | $3.55 | 180 | 1,240 | 29% | -0.62 |
| $50 | $1.85 | $1.95 | 1,420 | 6,800 | 28% | -0.47 |
| $47.50 | $1.05 | $1.12 | 960 | 4,150 | 30% | -0.31 |
| $45 | $0.55 | $0.62 | 540 | 3,020 | 32% | -0.18 |
| $42.50 | $0.28 | $0.35 | 95 | 880 | 35% | -0.10 |
| $40 | $0.10 | $0.25 | 4 | 60 | 39% | -0.05 |
Five things a seller should read off that table immediately:
What the numbers are telling you:
- The $47.50 line is the sweet spot: 0.31 delta, a $0.07 spread on a $1.08 mid (about 6%), and 4,150 open interest. You can get in and out.
- The $40 line is a trap. The $0.28 premium looks like free money until you notice the bid-ask is $0.10/$0.25. You would sell at $0.10 and buy back at $0.25, losing more to the spread than the trade pays.
- Volume of 4 and open interest of 60 on that same line confirm it: almost nobody trades this strike, so there may be no reasonable exit.
- IV climbs from 28% at the money to 39% at the lowest strike: that is skew, and it is why the far strikes look richer than their delta suggests.
- Delta doubles as a rough probability: the 0.31 line finishes in the money roughly 31% of the time.
The second and third bullets are the single most common beginner error on a chain: reading the premium column and ignoring the two columns that determine whether you can realise it (liquidity and the bid-ask spread). The fourth is covered in volatility skew and smile, and the delta-as-probability shortcut in choosing strikes by delta.
Bid, ask, and the mid price trap
When you sell premium, you typically sell near the bid and buy back near the ask. The mid price looks attractive on screen but is not what you realize. Wide spreads eat edge, especially on small accounts.
Liquidity quick test for sellers:
- Bid-ask width under ~10% of mid for names you trade regularly
- Open interest in the hundreds+ on your strike (guideline, not law)
- Volume not zero most days: stale chains cost on exit
- Compare adjacent strikes: if only one strike is liquid, you may be too far OTM or ITM

Choosing strike and expiration on the chain
Sellers trade off premium vs. probability. Farther out-of-the-money puts pay less but assign less often; nearer strikes pay more with more stock risk. Days to expiration (DTE) changes theta and gamma behavior. See theta decay for sellers.
Seven chain checks before selling:
- Underlying price vs. strike: where is your breakeven?
- DTE matches your plan (30–45 vs. weeklies vs. 0DTE)
- Delta of short strike aligns with risk tolerance
- IV and IV rank, not the only input (IV rank guide)
- Bid/ask acceptable for entry and exit
- Open interest supports your contract count
- No earnings or ex-dividend inside holding period unless intentional
Calls vs. puts on the same chain
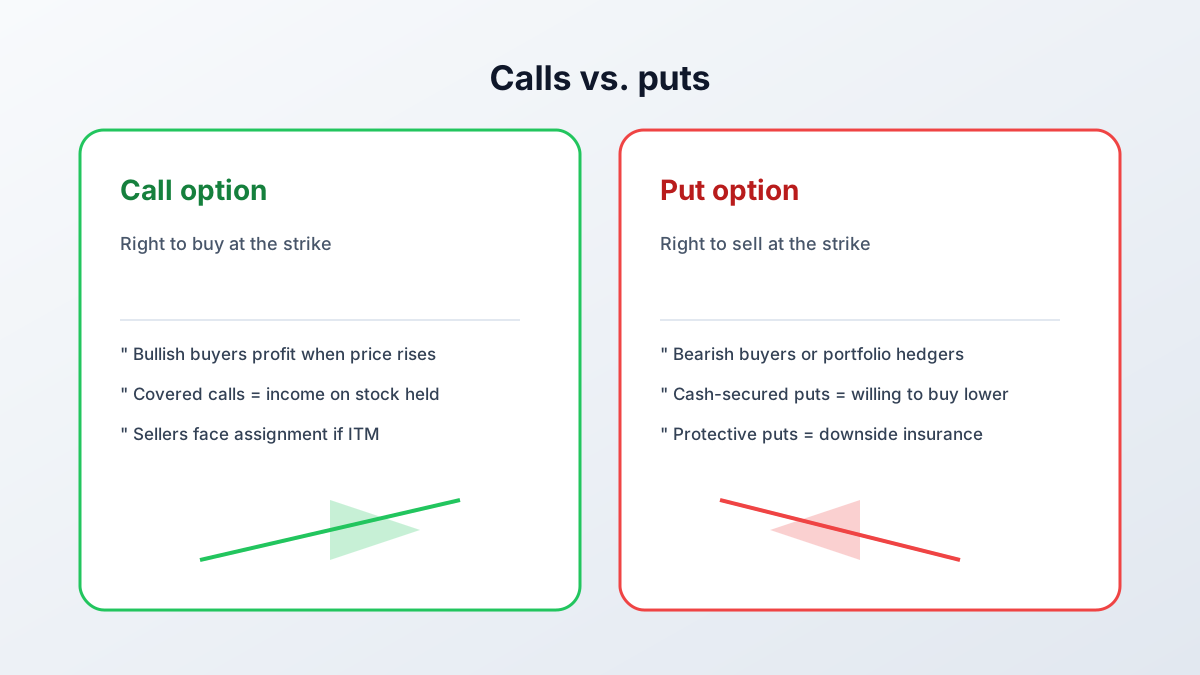
Covered call sellers scan call columns above the stock price. Put sellers scan puts below. Credit spreads pair two strikes on the same expiration row: compare credit spreads vs. naked puts.
A credit spread is read differently again: you are pricing two rows at once. Using the same chain as above, sell the $47.50 put at its $1.05 bid, buy the $45 put at its $0.62 ask, and the net credit is $0.43, or $43 per spread. The strike width is $2.50, so maximum loss is $250 minus the $43 collected, giving $207 at risk.
That single calculation reframes the whole chain. The cash-secured put on the same strike ties up $4,750 of collateral to collect $105; the spread risks $207 to collect $43. The spread's return on capital is far higher, its dollar income far lower, and it can lose its entire max in a single gap (credit spreads vs. naked short puts). Note also that you must cross the spread twice, selling at the bid and buying at the ask on both legs, which is why the four-leg structures punish an illiquid chain so badly.
The practical habit: before comparing premiums across strategies on a chain, convert every candidate to premium divided by capital actually committed. A $43 credit and a $105 credit are not comparable numbers until you know what each one required (return on capital for option sellers).
Covered calls explained and selling puts discipline apply chain reading to each strategy.
Greeks on the chain: what sellers glance at
Delta estimates how much the option price may move per $1 move in the stock. Theta shows daily time decay. Vega shows sensitivity to IV changes. Full definitions: options Greeks explained.
Seller-focused Greek habits:
- Short put delta roughly maps to assignment probability (not exact)
- Higher gamma near expiration: more P&L swing per day
- IV crush after events hurts short vega winners and helps if you overpaid vol
Conclusion: the chain is your pre-trade audit
A good seller reads the chain before the order ticket: liquidity, strike, DTE, and event risk. Log what you saw (bid, ask, delta, IV) in your journal so reviews teach instead of guess.
New terms? See the options selling glossary. Avoid common errors in mistakes option sellers make. Educational only, not personal financial advice.
Frequently asked questions
- What is an options chain?
An options chain lists all available strikes and expirations for calls and puts on one underlying, with bid, ask, volume, open interest, and often Greeks. It is the menu for every trade you might open.
- Should I use bid, ask, or mid price when selling options?
Sellers usually work from the bid (what buyers pay you). The mid price can overstate realistic fills on illiquid strikes. Check bid-ask width before sizing: a wide spread is a hidden cost.
- What open interest should option sellers look for?
Higher open interest and volume usually mean tighter spreads and easier exits. Very low OI strikes can trap you in a position when you need to roll or close.
- How do I pick a strike on the options chain?
Match strike to your thesis: CSP sellers pick where they want to own stock; covered call sellers pick where they will sell. Compare premium, delta, and days to expiration, not just the highest credit.
- What Greeks should sellers check on the chain?
Delta for directional exposure, theta for time decay, and vega for IV sensitivity. A quick glance beats opening blind, especially before earnings or ex-div datesGreeks explained.
- Why does a far out-of-the-money option show a high premium but low volume?
Because the quoted premium is the midpoint of a market almost nobody trades. A strike showing $0.10 bid and $0.25 ask has a mid of about $0.18, but you sell at $0.10 and buy back at $0.25: the round trip costs more than the trade pays. Volume and open interest in single or double digits confirm there may be no reasonable exit.
- Why does implied volatility differ between strikes on the same expiration?
That is volatility skew. In equities, implied volatility rises as strikes fall: persistent demand for downside protection bids up lower-strike puts. It explains why far out-of-the-money puts look richer than their delta alone would suggest, and it is a feature of the market rather than a pricing error to exploit.
From blog to product
Request access to the private beta and we will email you after review.
Request accessRelated articles

How to Run a Monthly Options Trading Review
Key takeaway: A repeatable monthly review for option sellers: which numbers to pull, the metrics that actually matter, how to break results down by ticker and strategy, and the questions to answer each month.
Read more
Trading Psychology for Option Sellers: The Biases That Cost You
Key takeaway: Trading psychology for premium sellers: why a 90% win rate distorts judgement, the traps of revenge trading and sunk cost, discipline in drawdown, and rules that survive stress.
Read more
Covered Call ETFs vs. Selling Your Own Calls
Key takeaway: Covered call ETFs versus selling your own covered calls: how the funds work, what the fees and capped upside really cost, tax and control differences, and who each option actually suits.
Read more